Imaging of Acoustically Coupled Oscillations due to Flow Past a Shallow Cavity: Effect of Cavity Length Scale
Peter Oshkai
> Research >
Recent and Ongoing Investigations
Department of Mechanical Engineering > University of Victoria
 Imaging of Acoustically Coupled Oscillations due to Flow Past a Shallow Cavity: Effect of Cavity Length Scale.
Flow-acoustic interactions due to fully turbulent inflow past a shallow axisymmetric cavity mounted in a pipe are investigated using a technique of high-image-density particle image velocimetry in conjunction with unsteady pressure measurements.
Imaging of Acoustically Coupled Oscillations due to Flow Past a Shallow Cavity: Effect of Cavity Length Scale.
Flow-acoustic interactions due to fully turbulent inflow past a shallow axisymmetric cavity mounted in a pipe are investigated using a technique of high-image-density particle image velocimetry in conjunction with unsteady pressure measurements.
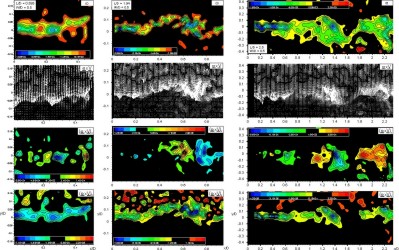
The left column of images shows representations of the hydrodynamic contribution to the acoustic power integral for the case of a relatively short cavity (L/D = 0.595, where L is the cavity length, and D is the inlet pipe diameter). Contours of constant vorticity are shown in the top plot. The bottom three plots show the distribution of the vectors w×V, and their streamwise and transverse projections [w×V]x and [w×V]y.The large negative values of the transverse component [w×V]y are primarily due to high values of w. Large values of the streamwise projection [w×V]x, of both positive and negative sign, also occur in the shear layer region. However, these contours of [w×V]x do not show a well-defined pattern due to the absence of large-scale structures in the shear layer.
The middle column corresponds to an intermediate value of cavity length (L/D = 1.04). As in the previous case, large, downward-oriented vectors are distributed along the shear layer. The large negative values of [w×V]y immediately downstream of the leading edge of the cavity are due to the high levels of distributed negative vorticity in this region. The highest values of [w×V]y occur at the location of the large-scale cluster of vorticity shown in the top plot. The contour plot of the streamwise component [w×V]x shows that the significant values of the x component occur along the shear layer. In contrast to the short cavity case, the absolute values of [w×V]x increase with increasing streamwise distance. Significant values of [w×V]x of opposite sign are especially evident for the large-scale vortex shown in the top plot.
A relatively large value of cavity length is represented by the plots of the right column. This case corresponds to L/D = 2.5. Similar to the case of the intermediate cavity length (L/D = 1.04), the larger vectors of the hydrodynamic contribution to the acoustic power w×V are distributed along the shear layer. The most significant values of the vertical component [w×V]y occur immediately downstream of the leading corner of the cavity, due to the high values of vorticity distributed in this region, and in the regions corresponding to the two large-scale vorticity concentrations. In addition, the absolute values of [w×V]x increase with increasing streamwise distance. The well-defined regions of the high values of [w×V]x of opposite signs due to the presence of the largest vortices.
The effectiveness of the acoustic power generation is determined by the dot product (w×V) · uac. In turn, the values of the dot product depend on the relative direction of the hydrodynamic contribution vectors w×V and the acoustic particle velocity uac. The direction of the acoustic particle velocity uac in the inlet and outlet pipes, as well as within the cavity away from its corners, is in the streamwise (x) direction. However, near the leading and trailing edges of the cavity, significant components in y direction are present. Therefore, a significant contribution to the acoustic power from the distributed vorticity is expected in the regions near the corners of the cavity. For the cases of long and intermediate cavity length, the large-scale vortices are also expected to contribute to the acoustic power integral due to the large value of the streamwise component [w×V]x associated with them. It should be noted, however, that the concentrations of high values of [w×V]x occur in pairs of opposite sign, which will tend to cancel their overall effect.
P. Oshkai, M. Geveci, D. Rockwell, and M. Pollack.
Click here for reference and abstract
poshkai@me.uvic.ca